Urban mobility and city structure are complex, dynamic phenomena that can be effectively analyzed through spatiotemporal data. This project seeks to explore artistic visualizations of such data to reveal patterns of movement, spatial interactions, and urban dynamics. By blending data science with artistic design, this research will examine how visual representations can enhance our understanding of urban spaces.
With the growing significance of data science, the data visualization and data-based story-telling is also emerging. It also utilized more and more as a part of the data journalism (e.g., [1], [2], [3]).
Data visualization is not just a tool for analysis but a powerful medium for storytelling. By transforming raw spatiotemporal data into artistic representations, a visual narrative can communicate complex urban dynamics in a compelling and accessible manner. Artistic visualizations can evoke emotions, provoke thought, and engage audiences in ways that traditional charts and maps cannot. By enhancing the narrative potential of data, this research aims to bridge the gap between analytical insight and public perception, fostering a deeper understanding of urban life and mobility patterns.
This project focuses on the visualization instead deep statistical analysis of merged datasets, providing opportunity to deeply study some plotting and visualization tools. The visualisations can be static, animated or interactive (web based), should be inclusive (prefer using colorblind friendly palettes) and, first and foremost, creative.
The expected outcome is a collection of artistic visualizations representing dynamics of a city, telling a story, utilizing mobile positioning and map data, and an assessment of how artistic visualizations enhance interpretability and engagement compared to conventional data visualizations.
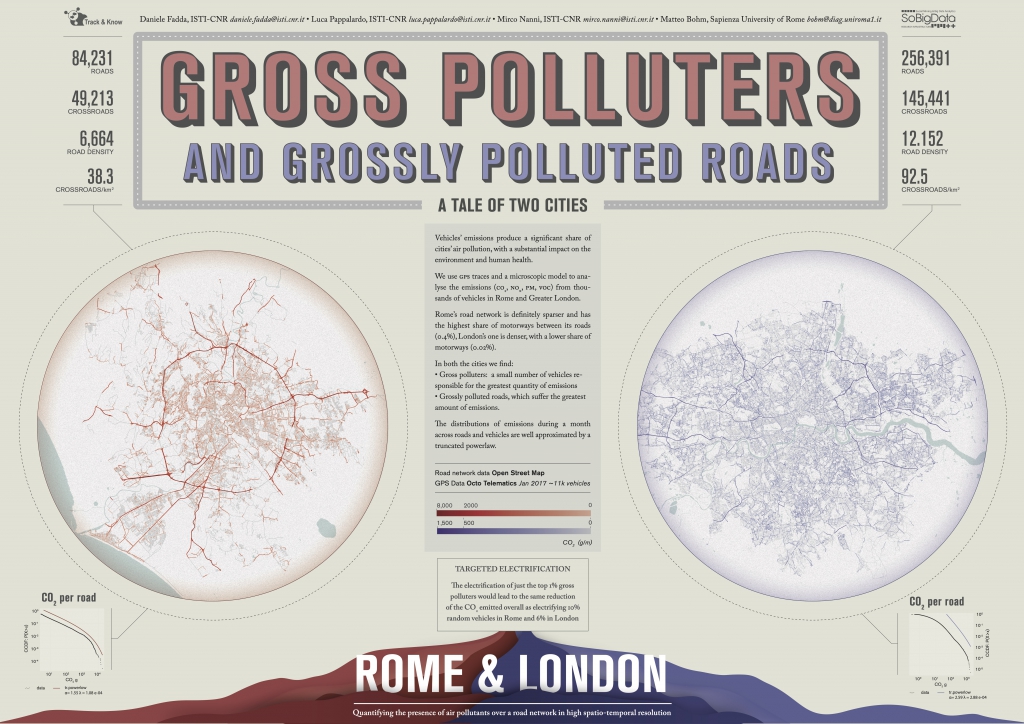
Some visualisations as an inspiration:
This project requires intermediate Python (alternatively R, Julia, etc.) skills, aesthetic sense and creativeness. It is good to have experience with spatiotemporal data and plotting packages (matplotlib, seaborn or d3.js, ggplot2/R, Gadfly/Julia, etc.).